More
Intelligent
Business
Put AI to work on your company's data, get vision and control over your business.
Contact Company DossierBy hiring our service, you will have access to a new way of approaching your business, you will make decisions based on real data and you will be ready to face market changes.
What do we do?
1

Analysis
Stakeholder interview and study of the organization and its objectives. Scope and deadlines definition. Work plan drawing up.
2

Indicators definition
Definition and weighting of variables to be visualized. Setting up of the relationships between them.
3

Definition of KPIs
From the previous metrics, KPIs are developed and linked to obtain a quick overview of specific situations.
4

Data Extraction, Transformation and Loading (ETL)
Data processing that includes, cleaning, aggregation, normalization, derivation, filtering, sorting and classification.
5

Data Warehousing
Intermediate data warehousing that enables operating independently of data origin.
6

Data modeling
In this stage, data is prepared for visualization, providing fast and secure access, especially for high-availability systems.
7

Visualization, Design and UX
Storytelling plays an important role in the user experience. This concept will be present all through the process, mainly in the solution design. It is important to know what the data is telling us.
8

Integration
Stage in which the developed solution is published. Reports can be i-framed in an app, accessible via web or visible in desktop editor, among other options.
9

Implementation
To make the product available for the whole organization requires coordinating actions, synchronizing databases and ensuring the necessary IT resources at the right time.
10

Training, support and maintenance
Each business and its collaborators require different levels of training and support, this also determines the success of the project and the subsequent ROI.
How can you use it?
Benchmarking
- Obtaining market information
- Analyze trends
- Study the competition
Data-driven marketing
- Improve shopping experience
- Predict consumption
- Define better pricing strategies and promotions

Operational Efficiency
- Response times
- Cycle time in service delivery
- SLA
- Process optimization
Artificial Intelligence
- Behavior forecasting
- Report automation
- Natural Language Query
- Virtual assistants’ deployment
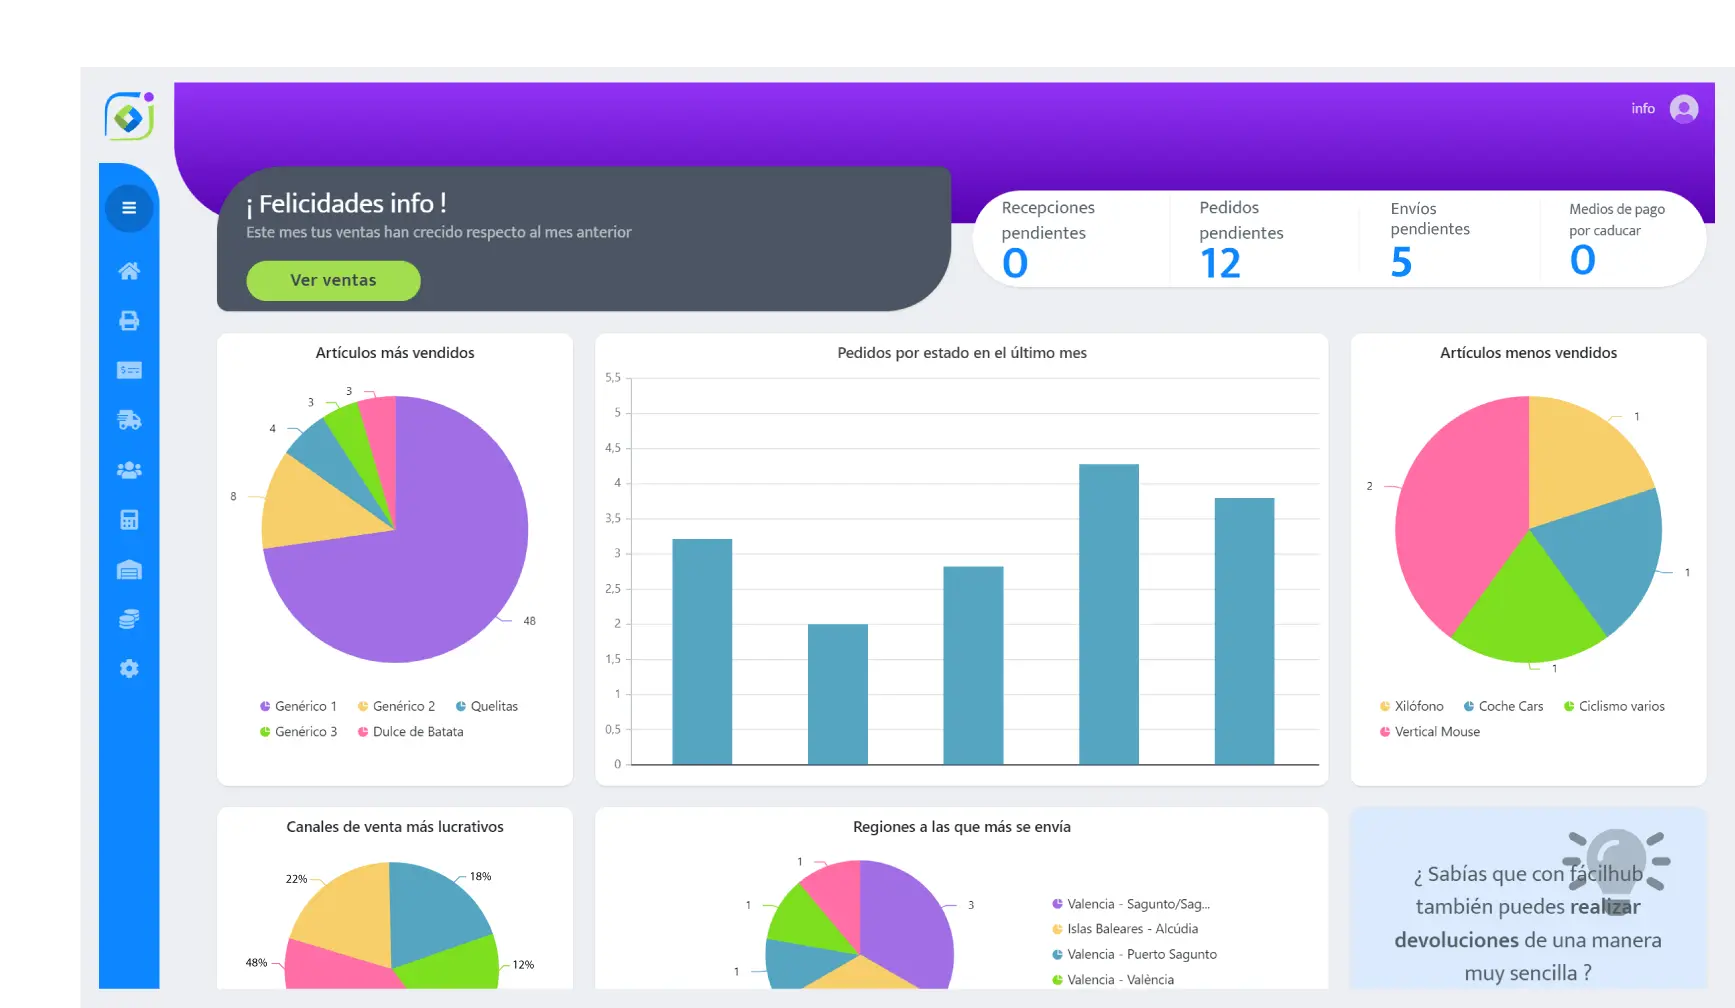
Success cases
- Dashboard for monitoring logistics operations.
- Profile-based access for internal and external users.
- SQL Server data source, visualization coded with ChartJS libraries.

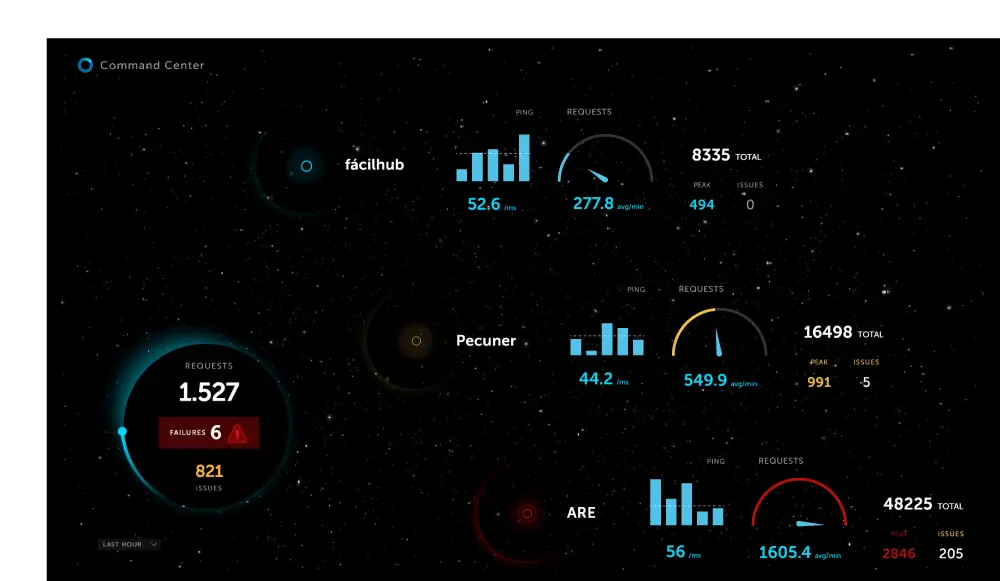
- Backend services monitoring system.
- Activity log optimization.
- Issue traceability reports.
- Custom visualization developed in HTML/ASP.NET/Blazor.

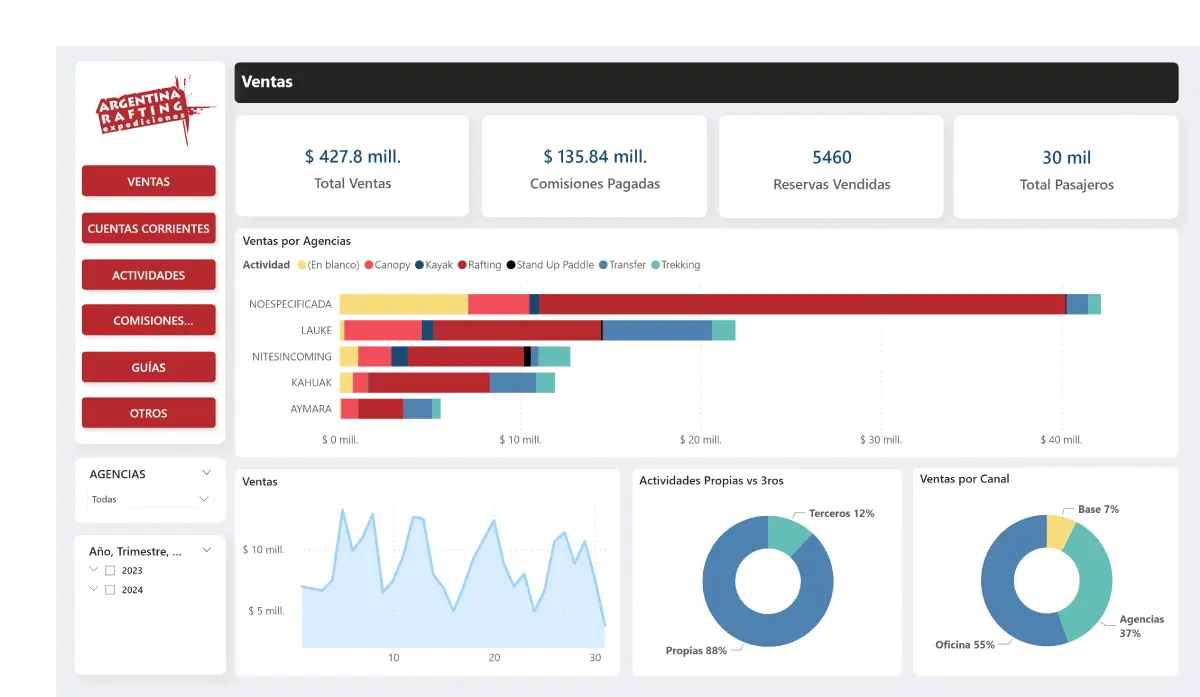
- Reports and Dashboards Development and Implementation in Power BI.
- Operational, commercial and administrative departments.
- Data injection via API, SQL and Google Drive.
- Custom i-framed solution in Progressive Web App.

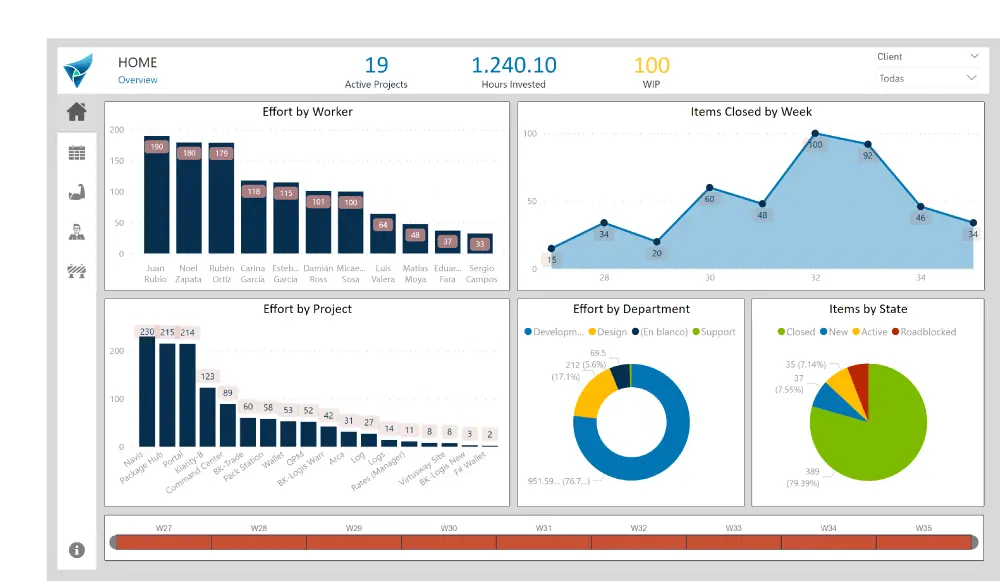
- Reports and Dashboard in Power BI for project tracking.
- Access for internal and external users via web.
- Key metrics for understanding effort and costs in technology projects.
Tech stack
-

Power Automate
-

Power Apps
-

Power BI
-

Power Virtual Agents
-

Power Pages
-

Power Fx
-

DataVerse
-

AI Builder
-

SQL Data Warehouses
-

Azure SQL
-

Azure SQL VM
-

Data Factories
-

SQL Database
-

SQL Server
Drive your business based on data
Ensure the right information is available for each team to get the best value out of the data.